Role
Senior Product DesignerLed design for skill assessments
Instructure set a goal for Bridge to grow revenue 20% a year. We had one month to design a talent management MVP for the CEO. Companies asked to buy it before any code was written, leadership funded it, and the product team doubled.
Business need
Bridge launched in 2015 as a learning management system. For 2016, Instructure set a goal for Bridge to grow revenue 20% a year. Our question was how to keep growing as a public company.
We wanted Bridge to be stickier, and to add real value, not just more features. A quarter of organizations weren't renewing their annual contracts.
Our CEO, Josh Coates, saw the opening in talent management. The plan was to move up-market, where competitors were already established, and help companies keep and train more of their people. We had one month to design an MVP he could see.
Customer problem
We started from Deloitte and Gartner research, talked with customers and experts, and held an offsite with the product team to explore ideas.
The once-a-year review was letting both of them down.
Behavior change
Feedback had to happen all year. Managers needed to check in and assess skills regularly, and employees needed to ask for feedback instead of waiting for it.
Hypothesis
If a manager could see their whole team in one place, with skills and the last 1:1 right there, giving feedback would become a habit. And if every assessment rolled up, companies could finally see where to train and where to hire.
Then we'd ask companies the direct question: if this were real, would you pay for it?
Solution
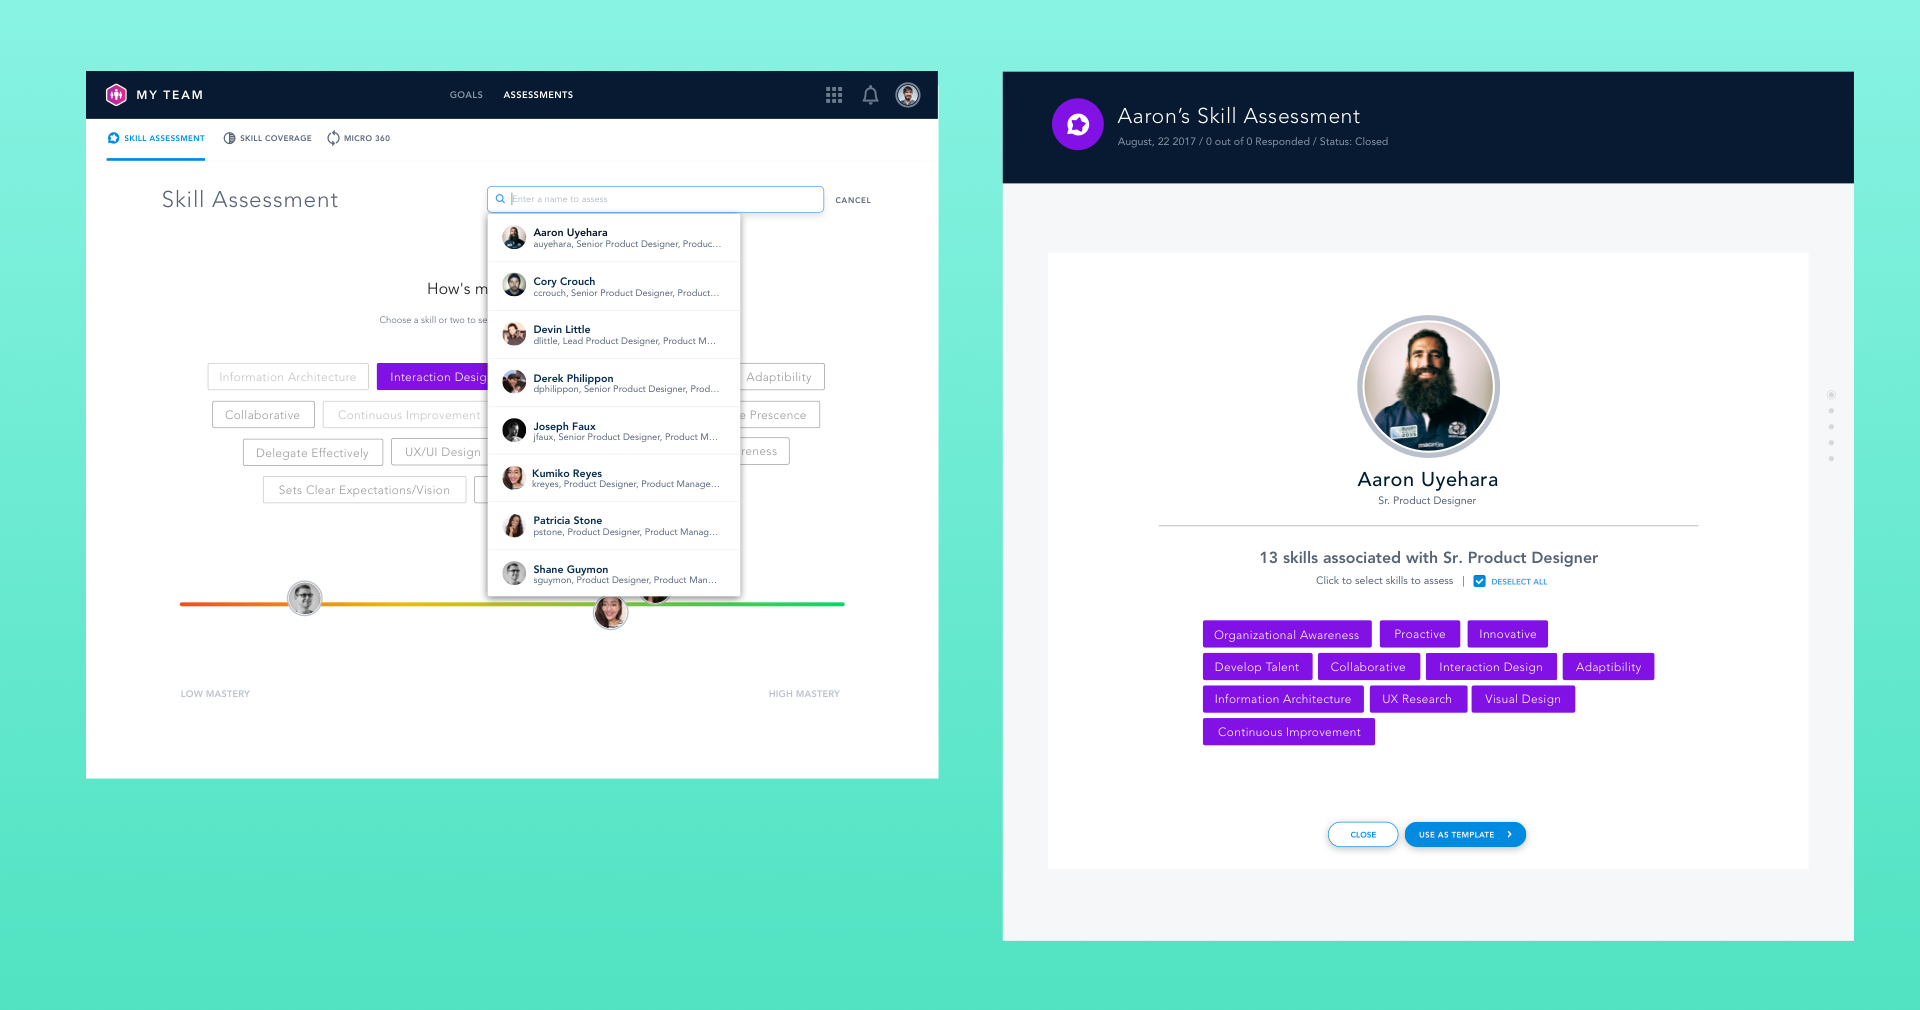
I led research, testing, and UX and visual design for the org chart, the skill assessments, and the manager dashboard.
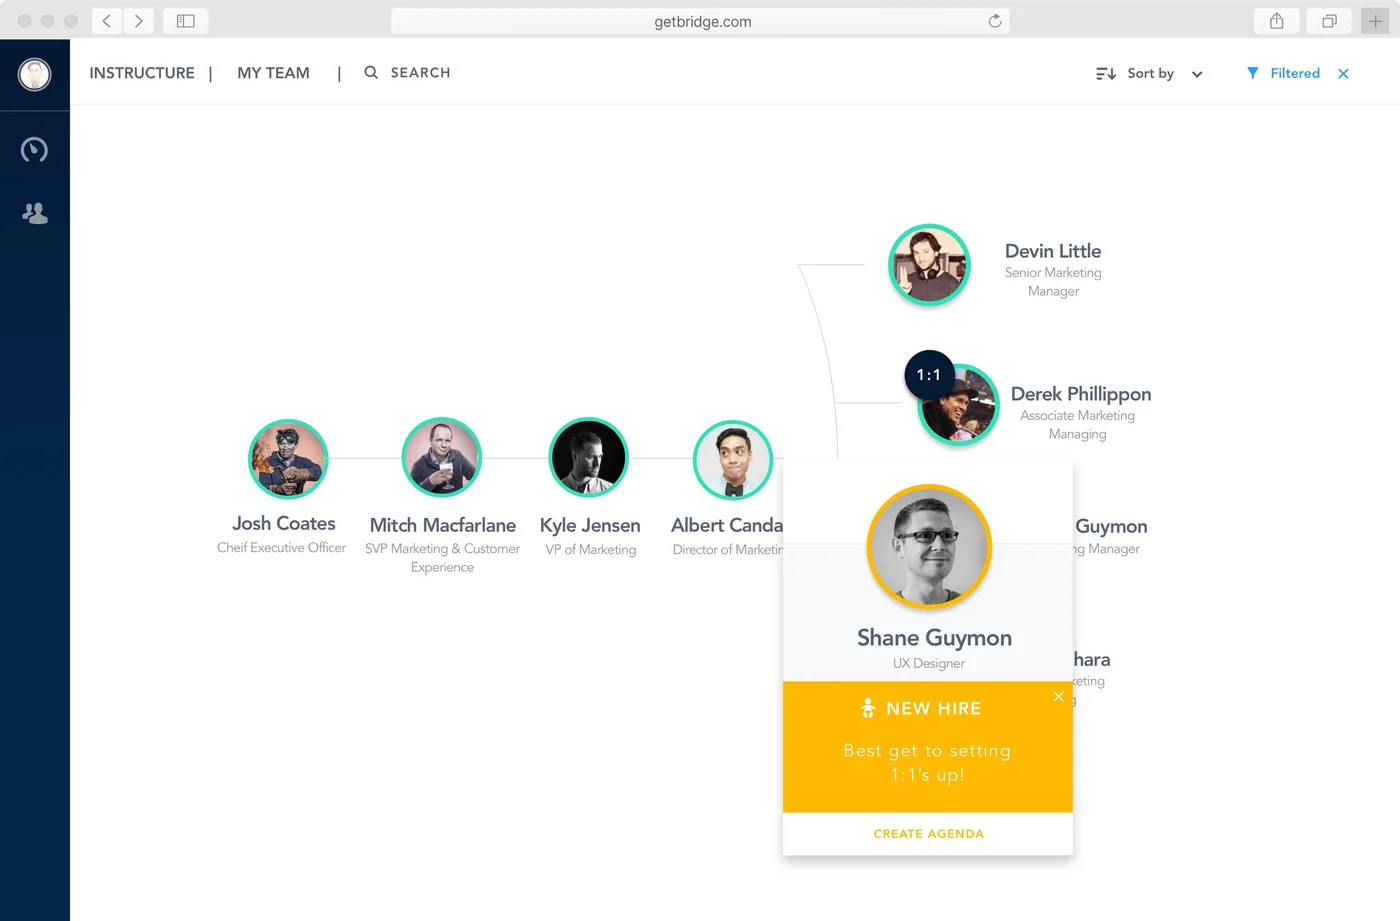
Leadership wanted to see the whole org and their direct reports at a glance. The org chart became the navigation, and it nudges managers when something needs attention, like a new hire who needs a first 1:1.
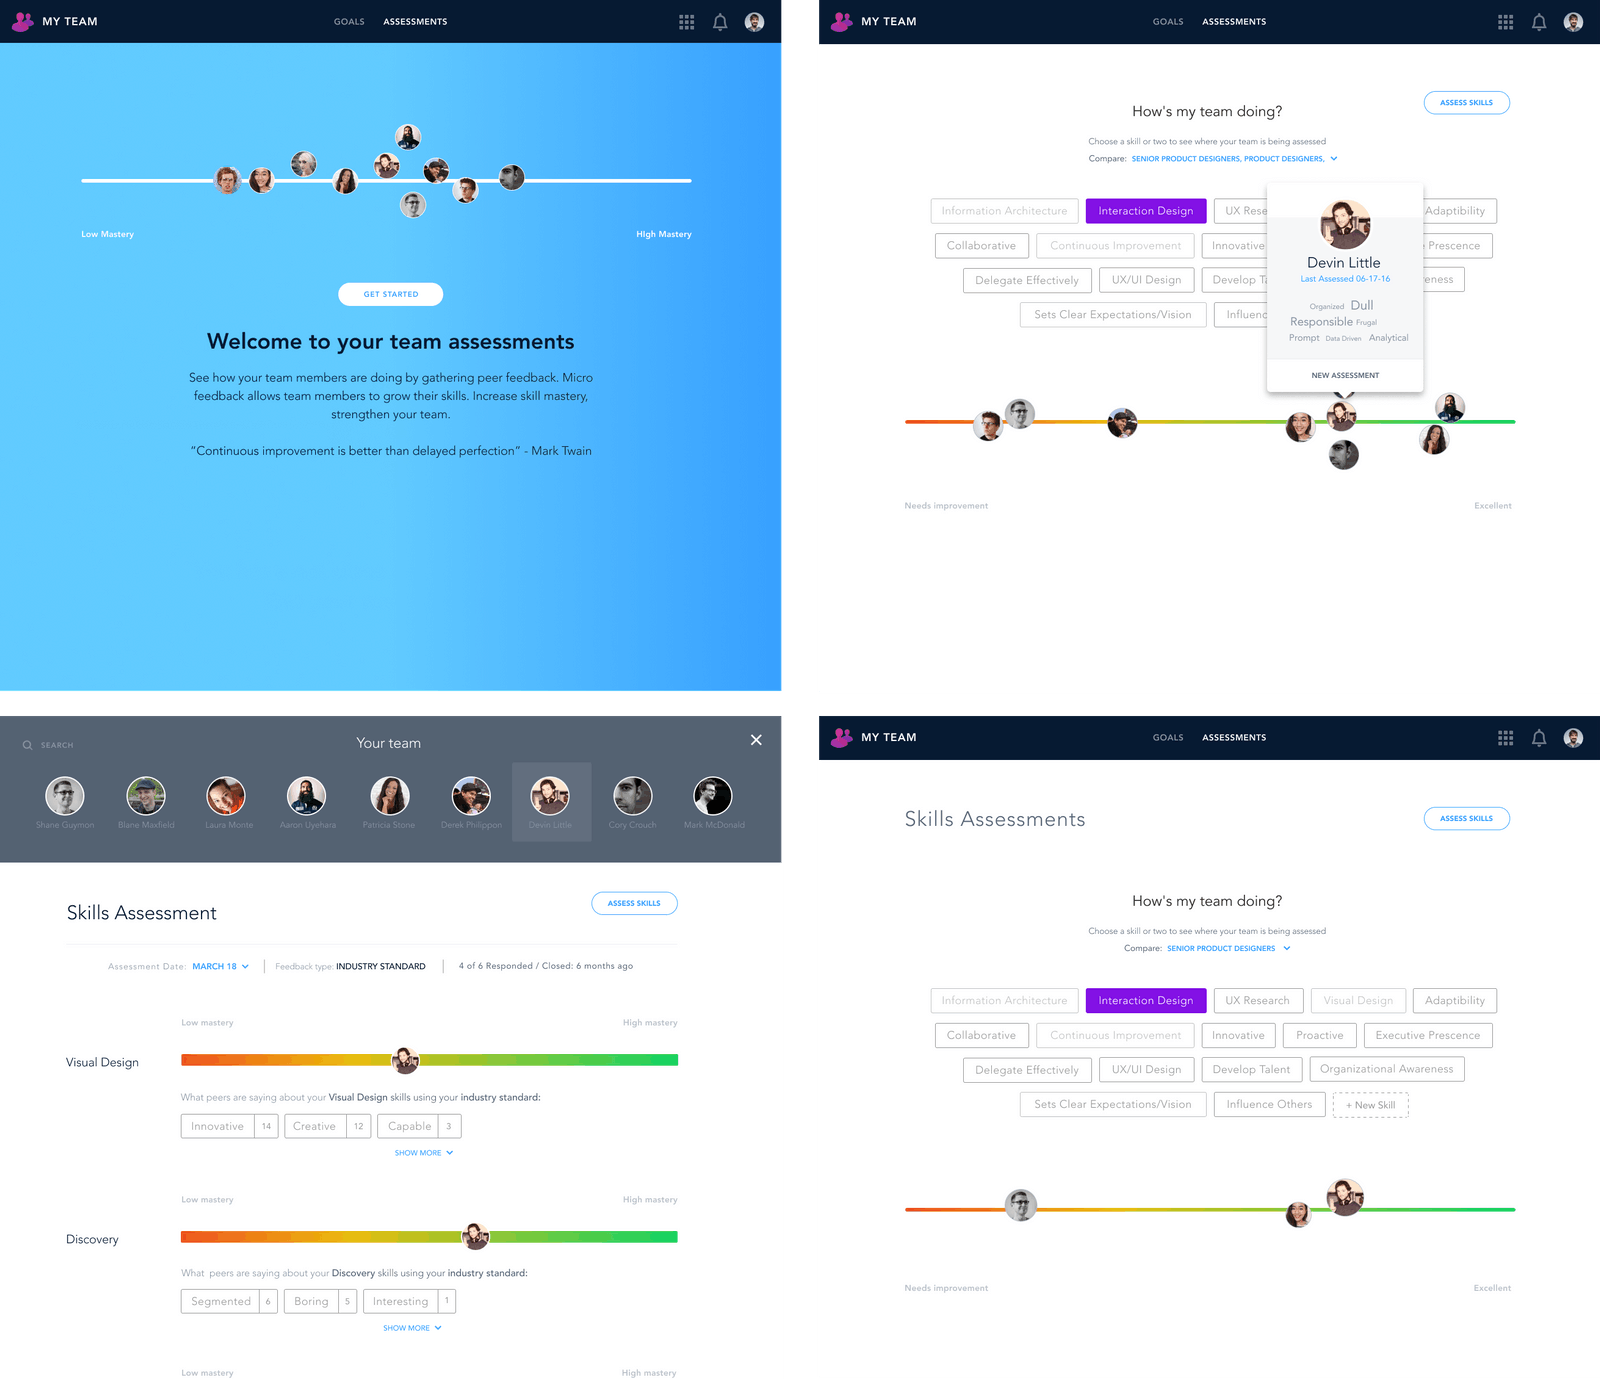
Managers and peers rate the skills that matter for someone's role, pick a few words, and add a comment. People see where they stand next to how they see themselves.
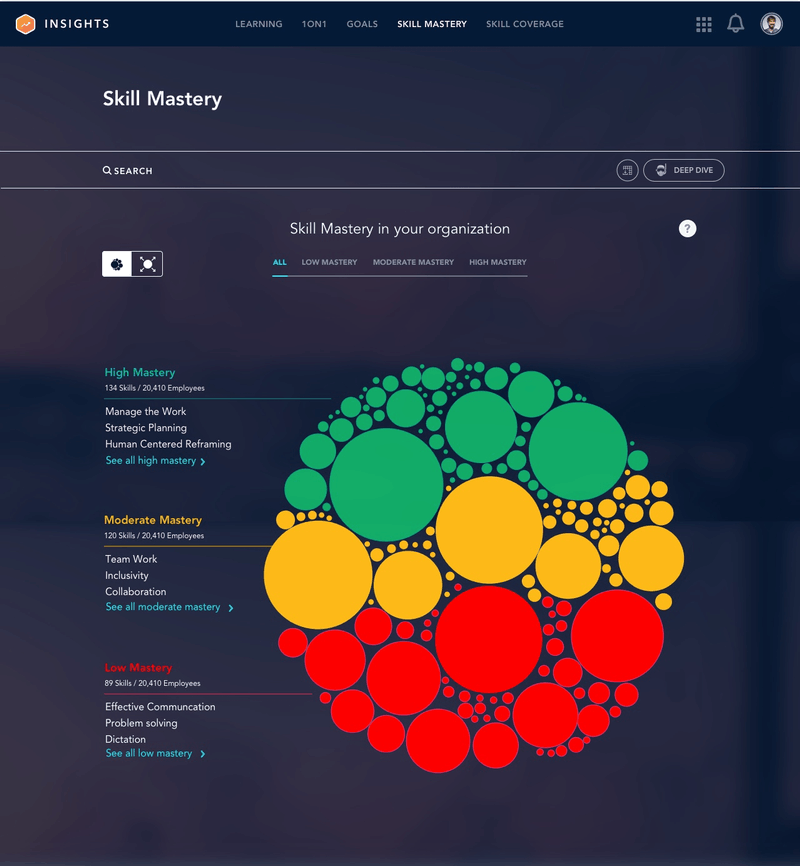
Managers get one dashboard with each person's goals, assessments, and days since their last 1:1, with a button to start the next one. Admins see skill mastery across the whole company, so they know where to train and where to hire.
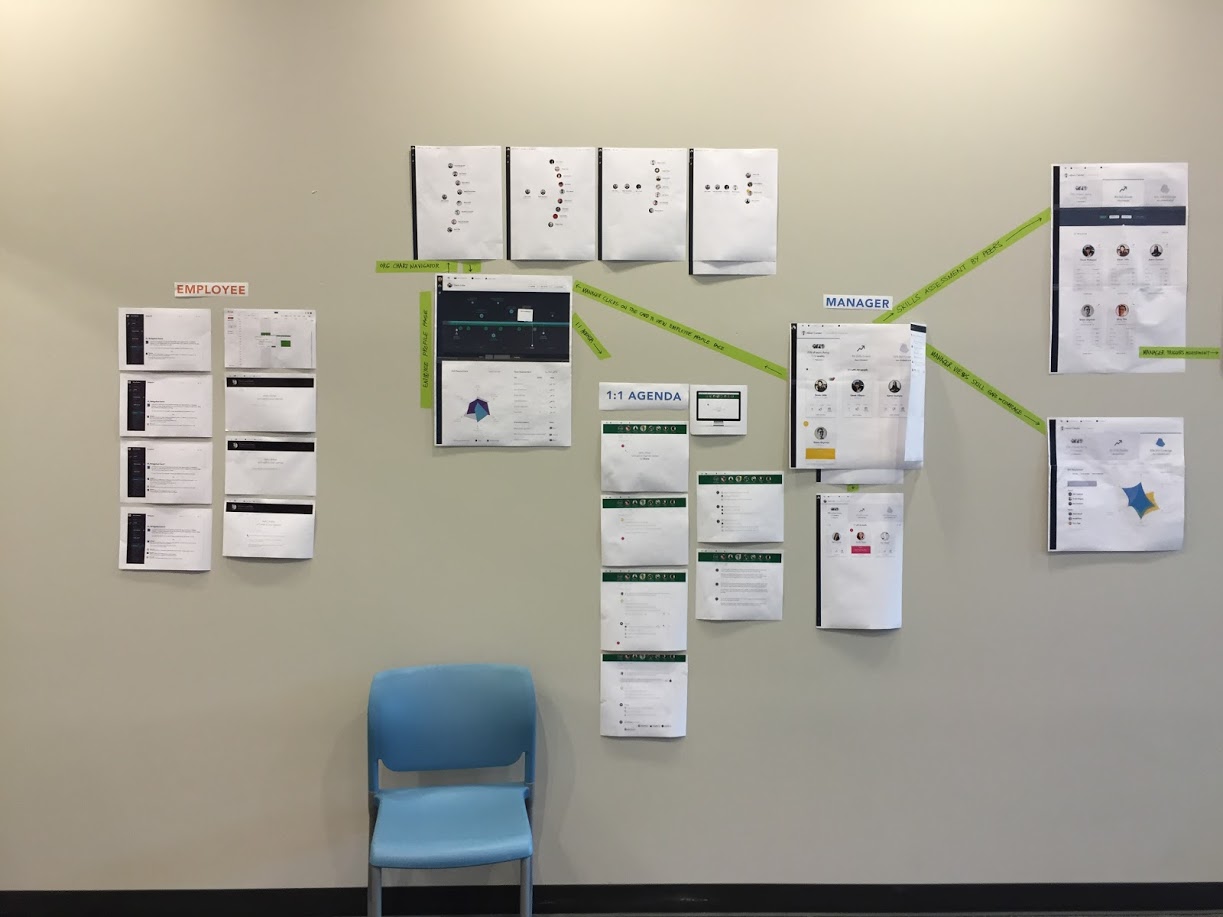
Four product and design pairs worked side by side, with every screen printed and taped to the wall. We sketched, pinned up new versions, and gave each other feedback every day. After the MVP, I led design for everything around skill assessments, and handed off with full specs and a clickable prototype.
Outcome
We took the prototype on a validation tour. When we asked companies if they'd pay for it, many said yes, right now, and we had to remind them no code existed yet. Executives wanted to build it as soon as possible.
The product team doubled: 4 new product managers, 4 new designers, 3 new program managers, 3 new development teams, and a new office in Pleasant Grove. About a year from concept, Bridge Perform was in alpha and beta.
Measurement
We proved companies wanted it before writing code. These are the numbers that would show whether it changed how managers work, and whether customers stayed.
Looking back
I'd set up a way to count 1:1s and assessments per manager before launch, so we'd know whether feedback really became regular.
A month, one room, and a CEO waiting pulled us together fast. Working through something hard side by side is what turned a group of people into a team.
Another Bridge story, and onboarding farmworkers 60% faster at Sendola.